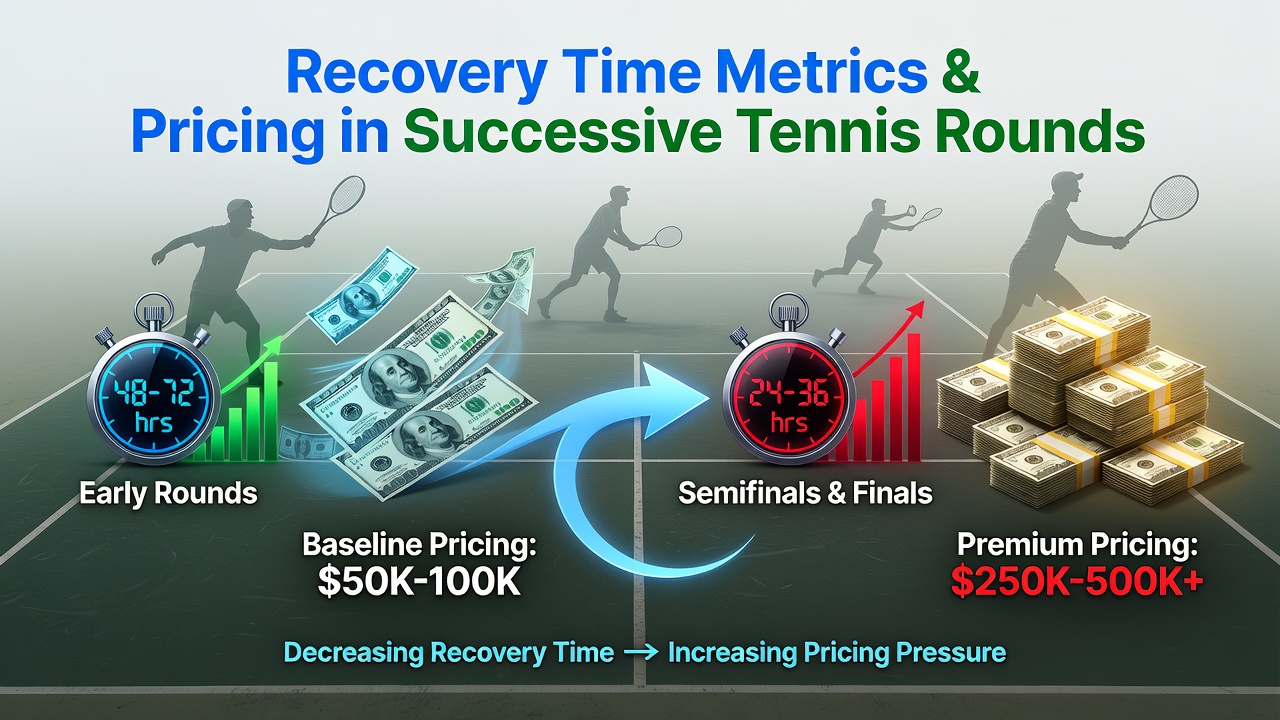
Recovery Time Metrics Drive Pricing Shifts Across Tennis Tournament Rounds
Recovery time between matches shapes how betting markets price outcomes in successive tennis rounds, and tournament schedules create measurable differences in rest periods that operators incorporate into their models. Grand Slam events space matches over multiple days while smaller ATP and WTA stops compress schedules, which forces players into shorter turnaround windows that affect performance indicators such as serve percentage, unforced errors, and rally endurance. Bookmakers adjust lines accordingly because historical match data shows clear patterns when athletes compete with limited recovery.
Measuring Recovery Across Tournament Structures
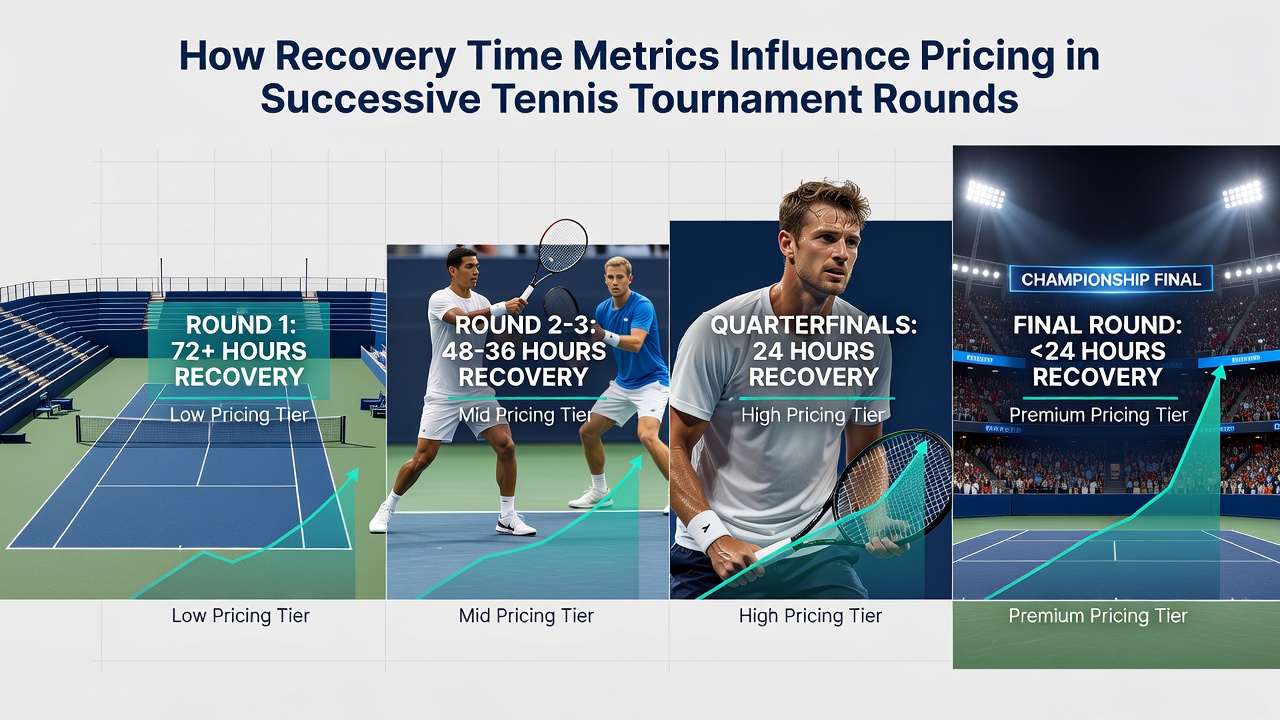
Tournament calendars determine baseline rest windows, yet individual factors like match duration, travel distance, and court surface add layers of variation that pricing engines track. In August 2026 the US Open hard-court swing will again place quarterfinalists on roughly 48-hour recovery cycles, whereas earlier rounds often allow 24 hours or less between contests. Data platforms compile sleep metrics, heart-rate variability, and distance covered in prior matches to refine those estimates before odds are published.
Operators pull from multiple sources when they build recovery profiles, including official tournament logs and wearable-device aggregates that players sometimes share through team channels. Shorter rest correlates with drops in first-serve points won and increases in double faults, patterns that appear consistently across both men’s and women’s draws. Pricing teams therefore widen or tighten spreads depending on the gap between a player’s last match and the upcoming fixture.
How Markets Translate Rest Data Into Odds
Live and pre-match pricing responds quickly once recovery metrics enter the model. A player scheduled for a late-evening match followed by a next-day afternoon start typically sees a modest line adjustment because fatigue models project reduced movement and slower decision-making under pressure. When both competitors face similar constraints the market often stabilizes, but asymmetric rest creates noticeable shifts in implied probabilities.
Research from the Australian Institute of Sport highlights that consecutive matches under 24 hours produce measurable declines in serve speed and lateral coverage, findings that betting syndicates integrate into algorithmic updates. Those same datasets feed into pricing engines that recalibrate as new recovery information arrives from practice sessions or medical reports. The result is a dynamic market where early-round underdogs with favorable schedules can carry higher implied value than surface or ranking statistics alone would suggest.
Examples From Recent Seasons
Take one hard-court swing where a top seed played five sets on Wednesday night and returned for a semifinal on Friday afternoon, while the opponent enjoyed a full day off after a straight-sets win. Markets opened with the rested player as a slight favorite despite lower ranking points, then moved further once betting volume reflected the rest disparity. Similar adjustments surface at indoor events where travel between cities compresses recovery windows even more.
Another pattern emerges in best-of-three formats on the Challenger circuit, where daily matches leave little margin for physical reset. Data collected across multiple seasons shows that players who compete on back-to-back days post lower win rates in the second contest when the opponent has an extra day. Pricing desks incorporate these percentages directly, creating lines that embed recovery edges rather than relying solely on head-to-head history.
Future Scheduling and Data Integration
Event organizers continue to experiment with protected rest periods in certain tournaments, yet commercial demands keep many schedules tight. In 2026 several ATP 500 events will test extended gaps between quarterfinals and semifinals to reduce injury risk, moves that could flatten recovery-driven pricing swings if adopted more broadly. Meanwhile data providers refine models by combining GPS tracking, subjective wellness surveys, and historical outcome files to produce more granular inputs for odds compilers.
Those inputs flow into systems used by both traditional bookmakers and exchange platforms, where liquidity providers adjust quotes in real time as recovery estimates update. The process remains transparent in aggregate because published lines reflect the consensus view of available rest data, surface conditions, and opponent profiles rather than isolated variables.
Conclusion
Recovery time metrics have become a core input for pricing successive tennis rounds because they capture performance variance that ranking points and recent form alone cannot explain. Tournament structures, travel demands, and match lengths create the raw differences that models quantify, and operators apply those calculations across early rounds through finals. As data collection improves and scheduling experiments continue, the relationship between rest windows and market lines will stay central to how successive matches are valued.