Recognizing Patterns in Live Tennis Markets by Merging Fatigue and Weather Data
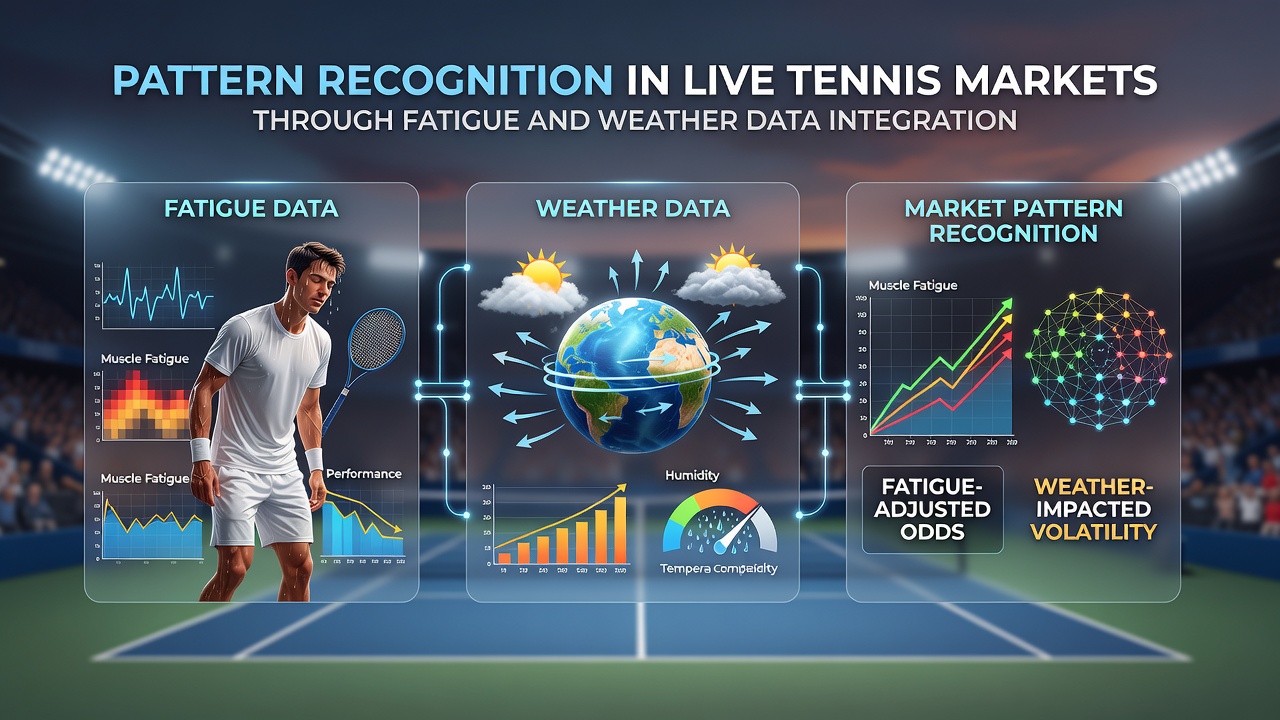
Live tennis markets rely on rapid shifts in player performance, and data integration now combines fatigue indicators with weather variables to identify recurring patterns. Fatigue metrics track match duration, sets completed, and recovery intervals between points, while weather data includes temperature, humidity, and wind speed that affect endurance and ball behavior. Observers note that these combined datasets reveal how certain players respond differently under prolonged heat or high humidity during outdoor events.
Researchers collect fatigue information from official match logs and wearable sensors that monitor heart rate alongside movement efficiency. Weather stations at tournament venues supply real-time readings that feed into analytical models. When these streams merge, patterns emerge such as serve accuracy declining faster for players with limited recovery time in temperatures above 30 degrees Celsius. Data shows these trends hold across multiple Grand Slam events where surface and scheduling vary.
Fatigue Measurement Techniques in Tennis
Analysts quantify fatigue through rally length averages and unforced error rates that increase after the second set in best-of-three formats. Studies from sports science institutions track how baseline players cover more distance and exhibit quicker declines compared with serve-dominant athletes. Those who study match statistics find that breaks between sets offer partial recovery, yet cumulative effects compound when matches extend beyond two hours. Integration with weather adds another layer because elevated humidity reduces sweat evaporation and accelerates perceived exertion.
Weather Variables and Performance Correlations
Weather conditions alter ball trajectory and player comfort in measurable ways. Higher temperatures increase ball speed on hard courts while simultaneously raising core body temperature for competitors. Data from meteorological services indicate that wind speeds exceeding 15 kilometers per hour disrupt serve toss consistency for many athletes. Humidity levels above 70 percent correlate with extended point durations because recovery breathing becomes less efficient. These factors combine with fatigue to produce identifiable sequences where underdogs maintain closer scores during later sets under adverse conditions.
Pattern recognition systems apply machine learning algorithms to historical matches that pair fatigue scores with concurrent weather readings. The models flag instances where a player's win probability deviates from pre-match expectations once specific thresholds are crossed. For example, athletes with prior three-set matches show reduced break point conversion when temperatures rise sharply in the afternoon session. Such observations allow markets to adjust odds dynamically as new data arrives during live play.
Data Integration Methods and Market Applications
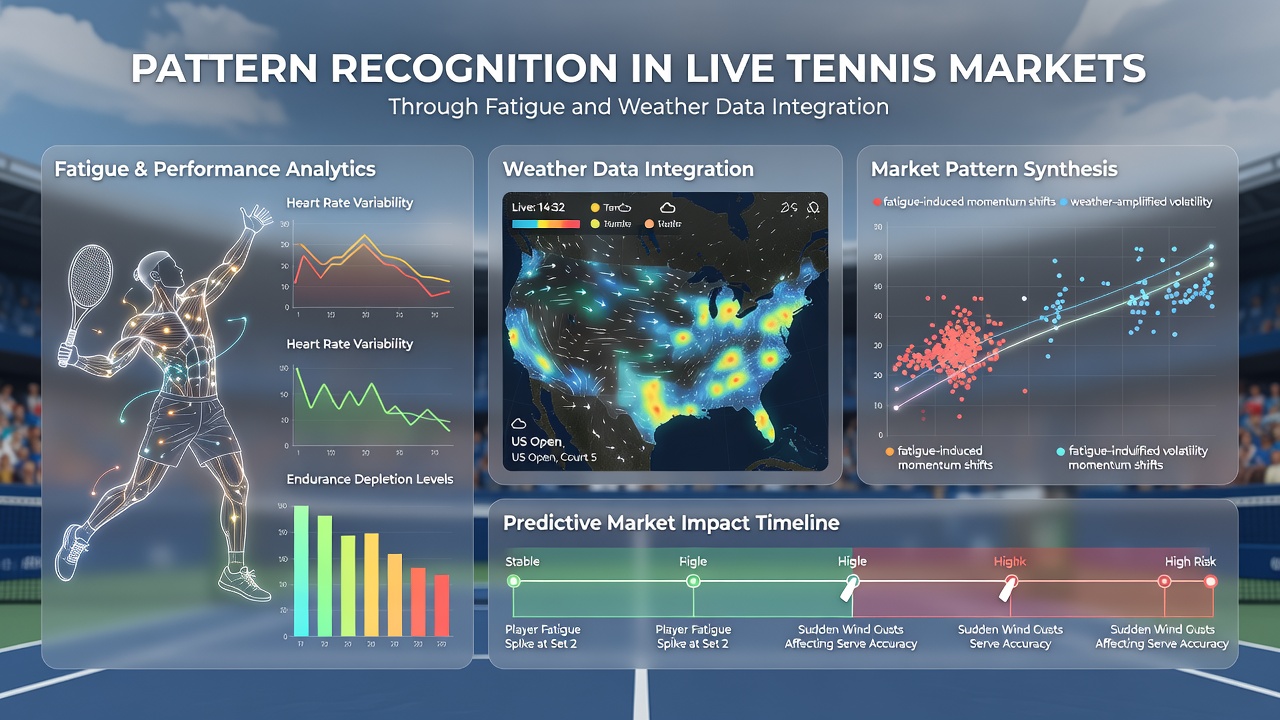
Software platforms merge fatigue and weather streams through timestamp alignment so that each point includes both player state and environmental context. Algorithms then scan for repeating sequences across thousands of matches. One documented pattern involves left-handed players maintaining higher first-serve percentages in windy conditions after reaching the third set, whereas right-handed counterparts experience quicker accuracy drops. These statistical edges appear consistently in outdoor tournaments scheduled during summer months.
August 2026 schedules include multiple hard-court events where afternoon heat and humidity frequently intersect with extended match times. Integration tools process venue-specific forecasts alongside live score feeds to highlight moments when fatigue-weather combinations favor certain tactical shifts. Market participants use these signals to monitor odds movements that align with or diverge from the identified patterns. Government statistical agencies in Australia and Canada publish periodic reports on sports performance data that support similar analytical approaches across different climates.
Case examples illustrate how integration works in practice. A player entering a quarterfinal after a five-set semifinal demonstrates measurable increases in double faults once humidity climbs and prior fatigue accumulates. Models trained on such events predict these spikes with greater accuracy than fatigue data alone. The combined approach also accounts for acclimatization differences, since competitors from temperate regions show steeper performance curves in tropical venues compared with those accustomed to warmer conditions.
Future Developments in Pattern Analysis
Advances in sensor technology and satellite weather monitoring continue to refine data granularity. Real-time updates now include court surface temperature alongside air readings, which affects bounce and movement. Academic research from European universities explores how these variables interact with individual player profiles stored in centralized databases. The resulting patterns help distinguish between random variance and repeatable responses that influence live market pricing.
Industry reports from tennis federations document how data-driven approaches have expanded since 2024, with particular growth in markets that incorporate environmental factors. Observers note that the volume of live data points processed during major tournaments has risen steadily, enabling finer pattern detection. Integration remains an evolving field where new variables, such as air quality indices, may soon join fatigue and weather as standard inputs.
Conclusion
Pattern recognition in live tennis markets advances through systematic combination of fatigue indicators and weather measurements. The resulting datasets expose repeatable sequences that shape performance outcomes and odds behavior. Continued refinement of collection methods and analytical models supports ongoing development in this area of sports analysis.