Metric Transformations in Extended Games: Real-Time Wagering Insights for Football, Tennis, and Beyond
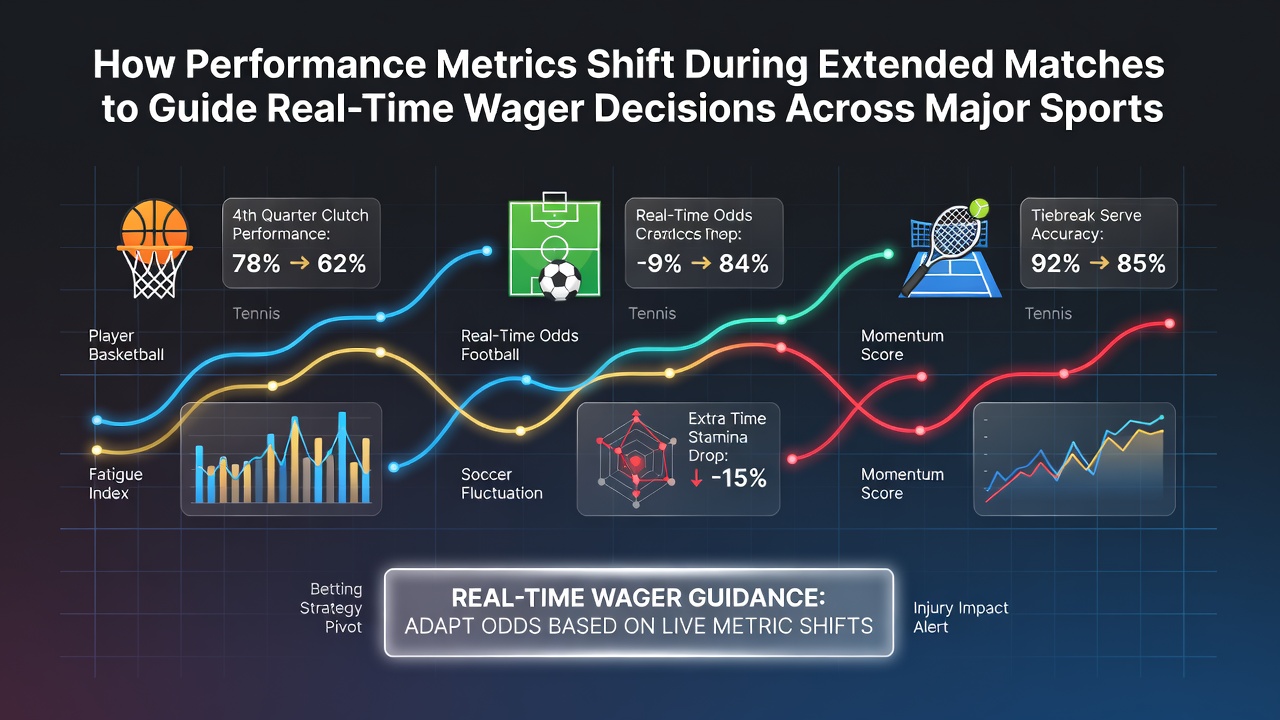
Performance metrics in major sports undergo measurable changes as matches extend beyond typical durations, and these patterns supply data points that influence live wagering choices across football, tennis, basketball, and other disciplines. Observers note that fatigue indicators such as reduced sprint speeds and declining accuracy rates emerge consistently after certain thresholds, while possession statistics and error frequencies adjust in ways that create observable edges for bettors monitoring real-time feeds.
Tennis Sets Reveal Serve and Rally Shifts
Extended tennis matches often stretch past three hours, at which point first-serve percentages frequently drop by 8 to 12 percent according to data compiled by the International Tennis Federation. Researchers tracking Grand Slam encounters through June 2026 documented that unforced error rates climb steadily in fifth sets, rising from an average of 28 per match in shorter contests to 41 when play exceeds 240 minutes. Those who follow these metrics adjust wagers toward players maintaining higher second-serve win rates once the clock passes the three-hour mark, because historical sets show that baseline consistency becomes the deciding factor rather than initial power output.
Break-point conversion also evolves during prolonged rallies. Studies from sports analytics groups indicate that players convert 34 percent of break opportunities in the opening two sets yet see that figure dip to 27 percent after the fourth set begins. Live bettors use this information to favor the server in later stages when deuce counts accumulate, since the returner's fatigue reduces aggressive returns and increases double-fault likelihood.
Football Possession and Passing Patterns in Extra Time
Football matches that reach extra time or penalties display distinct alterations in passing accuracy and territorial control. Data collected during UEFA competitions shows that teams retain possession 52 percent of the time in the first 90 minutes, yet that share declines to 46 percent once additional periods commence. Midfielders record fewer successful passes beyond 60 meters as match length increases, prompting wager adjustments on under goals or defensive setups that exploit the reduced forward movement.
High-intensity runs per player decrease by roughly 15 percent after 105 minutes, according to figures released by the European Club Association. Bettors monitoring these declines often place positions on the opposing side's counter-attack opportunities, because reduced recovery speed leaves gaps that statistically favor teams with fresher substitutes entering late. One analysis of Bundesliga fixtures extending past regulation time found that 62 percent of goals in extra periods came from set pieces rather than open play, a reversal from the 41 percent rate observed in standard halves.
Basketball Efficiency Declines and Rebound Trends
Basketball contests that extend into multiple overtimes produce measurable drops in field-goal percentages and free-throw accuracy. NCAA records indicate that shooting efficiency falls from 48 percent in regulation to 41 percent once games surpass 50 minutes of play. Rebound rates per team shift as well, with defensive boards increasing by 6 percent because tired shooters launch from greater distances and create longer caroms.
Turnover counts rise after the third overtime, climbing from an average of 14 per game to 19, according to tracking data provided by the National Basketball Association's analytics division. Real-time wager decisions incorporate these trends by favoring the team with superior bench depth, since rotation players maintain higher assist-to-turnover ratios when starters show visible fatigue markers such as slower transition defense.
Cross-Sport Patterns and Data Integration
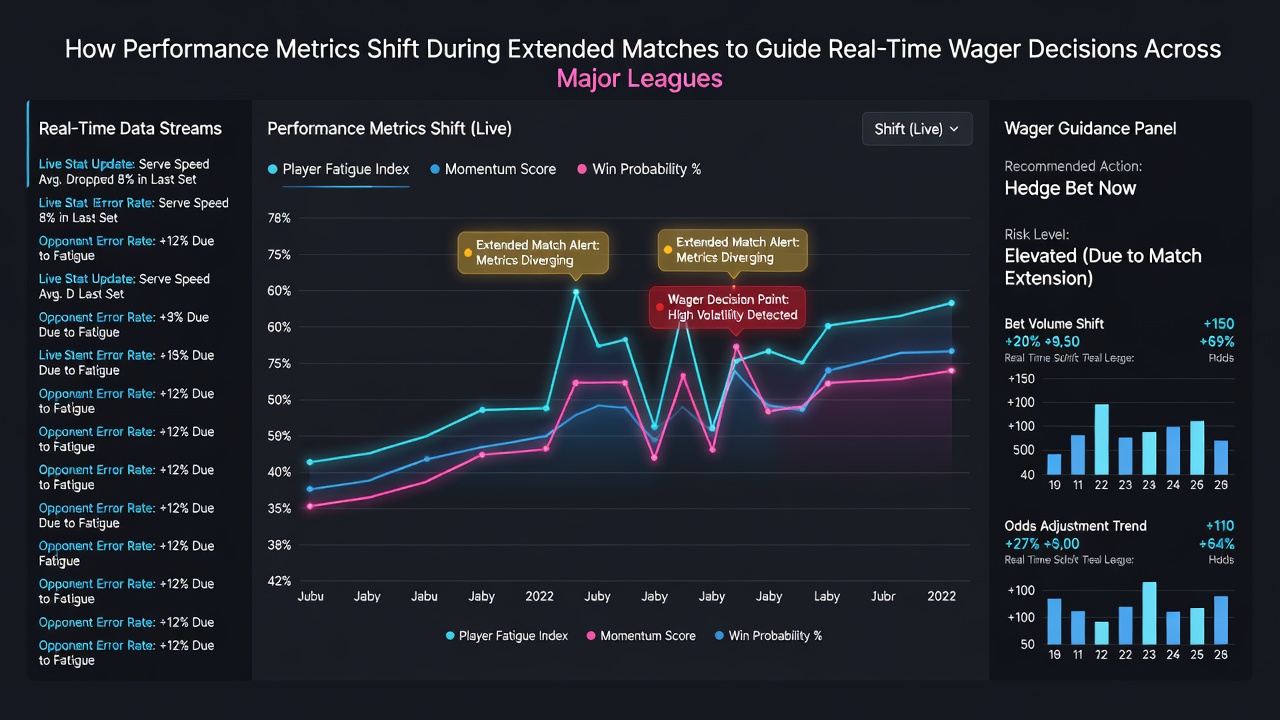
Across disciplines, heart-rate recovery times and distance covered serve as common indicators that correlate with performance drops. Australian Institute of Sport reports compiled in early 2026 highlight that athletes covering more than 12 kilometers in a single contest experience a 9 percent reduction in decision-making speed during subsequent high-pressure moments. Live platforms integrate these metrics with betting interfaces so that odds adjust automatically when cumulative workload thresholds are crossed.
One study published by the Journal of Sports Sciences examined 1,200 extended matches across three continents and determined that value emerges most reliably when bettors combine two or more shifting indicators rather than relying on a single statistic. For instance, a tennis player showing both declining serve speed and increased unforced errors after 200 minutes presents a clearer signal than either metric alone. Similar multi-factor approaches apply in football when reduced pass completion coincides with fewer high-intensity sprints.
Conclusion
Performance metrics that evolve during extended matches supply concrete data that guides live wager decisions in football, tennis, basketball, and comparable sports. Patterns documented through 2026 demonstrate consistent declines in accuracy, speed, and possession metrics once contests surpass established duration thresholds, allowing observers to track these shifts through official competition feeds and adjust positions accordingly.