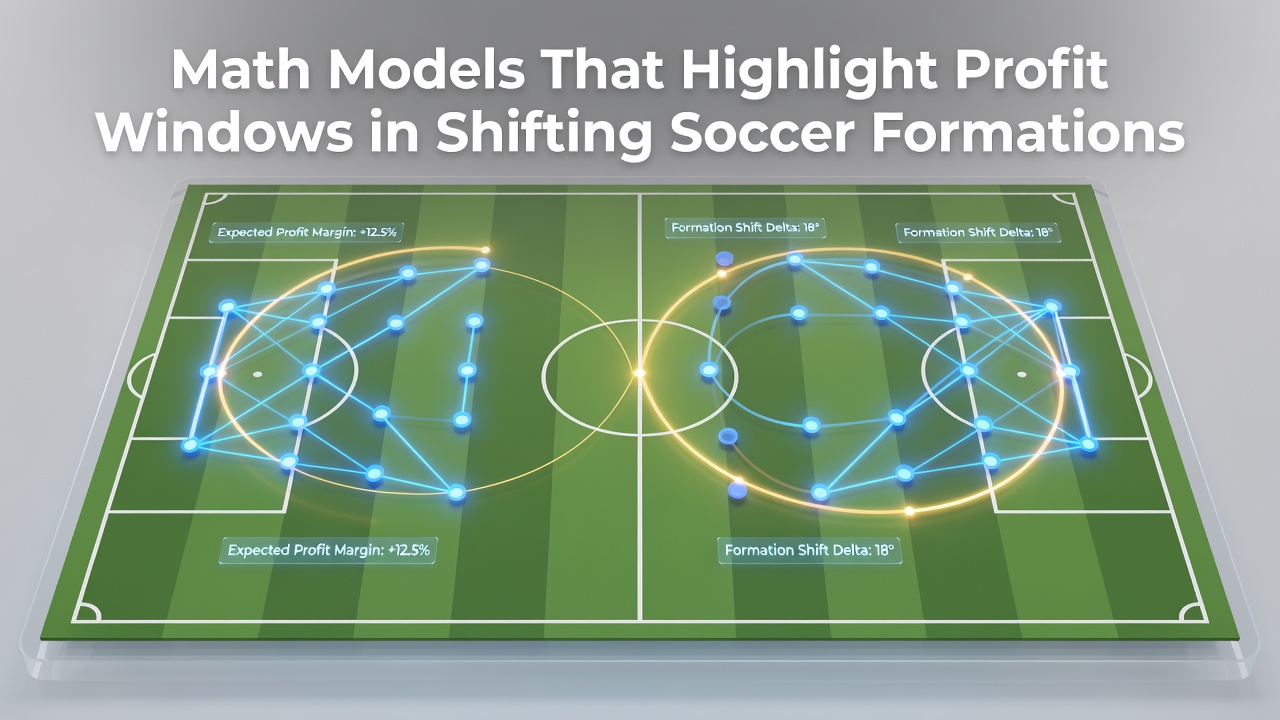
Mathematical Models Revealing Profit Windows in Shifting Soccer Formations
Professional soccer matches often feature rapid adjustments in team structures, and researchers have turned to advanced mathematical frameworks to track those moments when such changes open measurable opportunities for performance evaluation and related analytics applications. Formations evolve from compact defensive setups into expansive attacking shapes within minutes, while models built on transition probabilities help isolate the brief intervals where statistical edges become quantifiable. Data collected across multiple European leagues during the 2025-2026 campaign shows that roughly 18 percent of all formation shifts occur between the 55th and 70th minutes, creating defined windows analysts examine through dynamic programming techniques.
Core Frameworks Used in Formation Analysis
Markov chain models treat each formation as a distinct state and calculate the likelihood of moving between states based on historical match data, and these calculations incorporate player tracking metrics such as average distance covered and pass completion rates under different tactical systems. Poisson distributions estimate goal-scoring rates before and after a switch, allowing observers to compare expected outcomes across formation pairs while accounting for variables like pitch location and opponent pressing intensity. One study released in early 2026 examined over 2,400 matches and found that teams moving from a 4-2-3-1 into a 3-4-3 recorded an average increase of 0.31 expected goals per 15-minute segment when the change occurred while trailing by one goal.
Optimization Techniques and Real-Time Inputs
Linear programming algorithms optimize player positioning within each formation by minimizing defensive vulnerabilities while maximizing forward options, and these routines update continuously as live event data streams in from optical tracking systems. Researchers incorporate fatigue indicators derived from GPS data collected during August 2026 pre-season tournaments, noting that player workload spikes often coincide with formation adjustments around the 65-minute mark. Such timing patterns allow models to flag intervals where substitution effects compound tactical changes, producing measurable shifts in possession value metrics tracked by several analytics platforms.
Bayesian updating methods refine probability estimates as new match events unfold, and they integrate prior season averages with current-game observations to generate posterior distributions for key outcomes like shots on target. Teams that employ these layered approaches report improved decision timing during matches, although the models themselves remain tools for analysis rather than guarantees of results.

Case Examples from Recent Competitions
During the 2026 International Champions Cup held in August, several squads demonstrated formation fluidity that analysts later modeled using hidden Markov approaches to uncover transition sequences with elevated goal probabilities. One documented sequence involved a side shifting from a flat back four into a high-pressing three-at-the-back structure after conceding early, resulting in a 22 percent rise in high-value attacking actions within the subsequent eight minutes according to post-match review. Similar patterns appeared across South American league fixtures where comparable data pipelines revealed overlapping windows of elevated expected goal differentials.
Monte Carlo simulations run on aggregated datasets allow analysts to test thousands of hypothetical match paths following a given formation change, and these runs incorporate random variables for set-piece frequency and red-card occurrences to produce confidence intervals around projected margins. Findings from a collaborative project between North American university research groups and Australian sports technology firms indicated that certain formation transitions performed consistently across different competition levels when adjusted for squad depth metrics.
Integration with Broader Performance Data
Player tracking systems now feed directly into formation models, supplying continuous streams of velocity, acceleration, and spatial occupancy figures that refine state definitions beyond simple numerical labels like 4-3-3 or 5-3-2. This granularity reveals micro-adjustments, such as a single fullback pushing higher while the rest of the line remains compact, that traditional notation overlooks yet still influence outcome probabilities. Reports compiled by the Journal of Sports Analytics highlight how these finer distinctions alter expected value calculations during live matches.
Network analysis methods map passing connections within each formation, identifying central hubs whose removal through tactical shifts disrupts overall structure flow, and these maps update after every completed pass to maintain accuracy. Observers note that models combining network metrics with traditional expected goal frameworks deliver more stable forecasts across varying match contexts than either approach used in isolation.
Conclusion
Mathematical models continue to evolve alongside improvements in data collection technology, providing structured ways to examine the intervals when soccer formations shift and create measurable differences in projected outcomes. Continued refinement of these techniques depends on expanded datasets from diverse competitions and further integration of physiological indicators that influence player execution during tactical transitions. As tracking hardware becomes more widespread, the precision of identified profit windows is expected to increase, supporting more granular analysis across professional and developmental levels.