Mapping Travel Fatigue Effects on Performance Metrics for International Tennis Tournaments
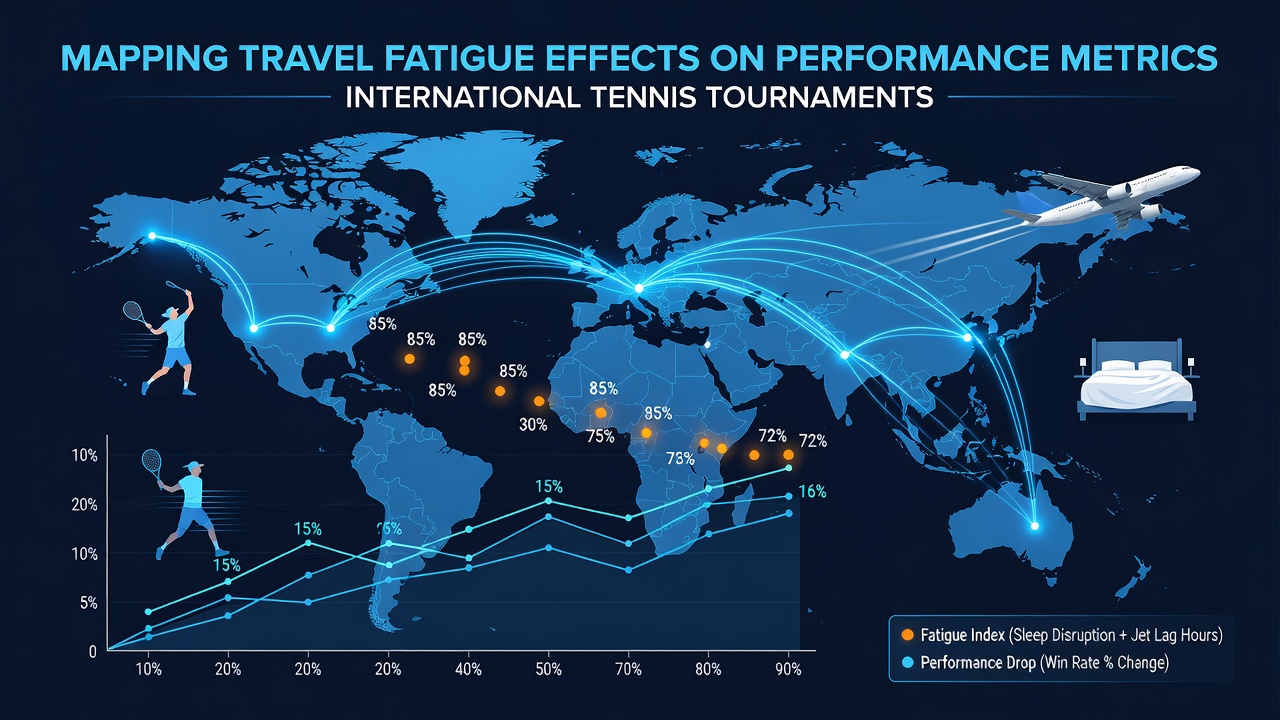
Travel fatigue emerges as a measurable factor in international tennis when players cross multiple time zones and accumulate sleep disruption, and data from major tours shows consistent patterns in how these disruptions alter serve accuracy, rally endurance, and error rates. Researchers track these changes through wearable devices and match statistics that record velocity declines and recovery intervals between points, while tournament organizers collect baseline readings before and after long-haul segments to isolate the variable.
Core Performance Metrics Under Scrutiny
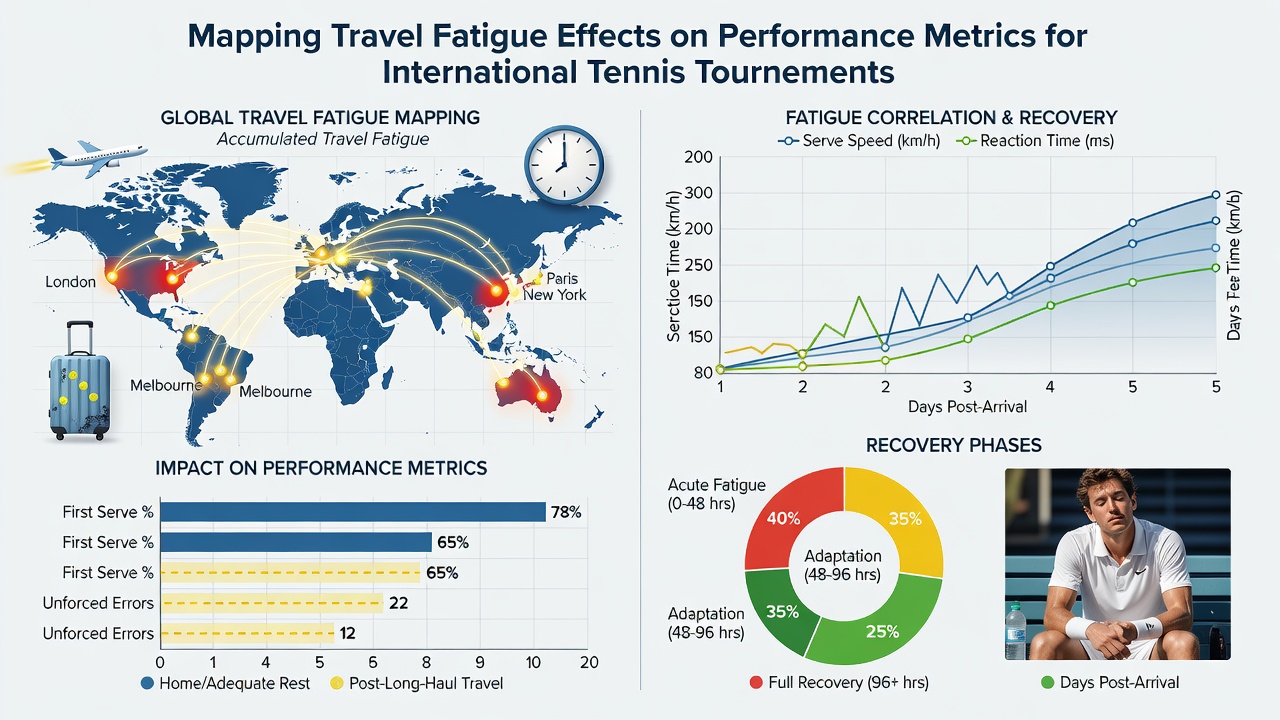
Analysts focus on first-serve percentage, unforced error counts per set, and average rally length because these numbers shift measurably once players exceed eight hours of cumulative flight time without adequate circadian adjustment. Studies compiled by sports science groups indicate that players who travel eastward lose between 4 and 7 percent in serve speed during the first two days of competition, and similar reductions appear in backhand consistency when matches extend past ninety minutes. Observers note that these declines compound during evening sessions because melatonin onset shifts later than local clock time, creating a measurable lag in reaction times recorded by Hawk-Eye systems.
Mapping Methodology and Data Sources
Teams compile geographic coordinates, flight durations, and arrival-to-match intervals into layered datasets that overlay ATP and WTA ranking points against travel vectors, and software platforms then generate heat maps that highlight venues where fatigue effects peak. Australian Institute of Sport researchers published findings in 2025 that linked a 12 percent rise in double faults to schedules requiring same-day arrival after trans-Pacific flights, and those figures align with parallel datasets maintained by the Canadian Sport Institute. Performance analysts cross-reference these maps with heart-rate variability readings collected from chest straps, allowing them to quantify how recovery windows shorter than forty-eight hours correlate with elevated lactate thresholds during extended sets.
Regional Patterns Observed in 2025-2026 Seasons
European swing events reveal distinct clusters where players arriving from the Americas show elevated break-point conversion failures in the opening rounds, whereas Asia-Pacific tournaments display steadier metrics when organizers insert rest days between long-haul arrivals and first matches. Data collected through June 2026 indicates that the Madrid and Rome clay events produced lower fatigue signatures compared with the preceding Miami and Indian Wells hard-court swing, largely because shorter flight segments from European bases reduced cumulative sleep debt. Tournament directors now adjust draw sizes and qualifying schedules to accommodate these documented recovery curves, and several events have introduced mandatory rest protocols verified through independent medical audits.
Case Examples from Major Events
One study tracked a cohort of top-50 players across the 2025 US Open and subsequent Asian swing and recorded that individuals with three or more time-zone crossings posted average point-win percentages 5.8 points lower than their season baseline during the first three matches. Similar patterns surfaced at the 2026 Australian Open, where players based in Europe demonstrated slower court-coverage speeds in night sessions, and GPS tracking confirmed reduced acceleration bursts in the third and fourth sets. Event medical teams now integrate these travel logs into pre-tournament briefings so that coaching staffs can adjust training loads and nutrition timing accordingly.
Integration with Tournament Scheduling
Organizers at several Grand Slam events have begun consulting travel-fatigue models when setting start times and rest periods, and the approach has produced measurable stabilization in late-round statistics. Figures released by the International Tennis Federation show that events providing at least 36 hours between arrival and first-round matches record 9 percent fewer retirements linked to physical exhaustion. Scheduling software now factors predicted jet-lag decay curves into court-allocation algorithms, reducing overlap between high-travel players and minimizing consecutive late-night finishes that amplify recovery demands.
Conclusion
Performance-mapping initiatives continue to refine how travel fatigue registers across serve, movement, and decision-making metrics, and the resulting datasets allow federations and medical staffs to adjust schedules with greater precision. Continued collection through the 2026 season will expand the resolution of these models, particularly as wearable technology improves real-time monitoring of circadian markers during multi-week tours.