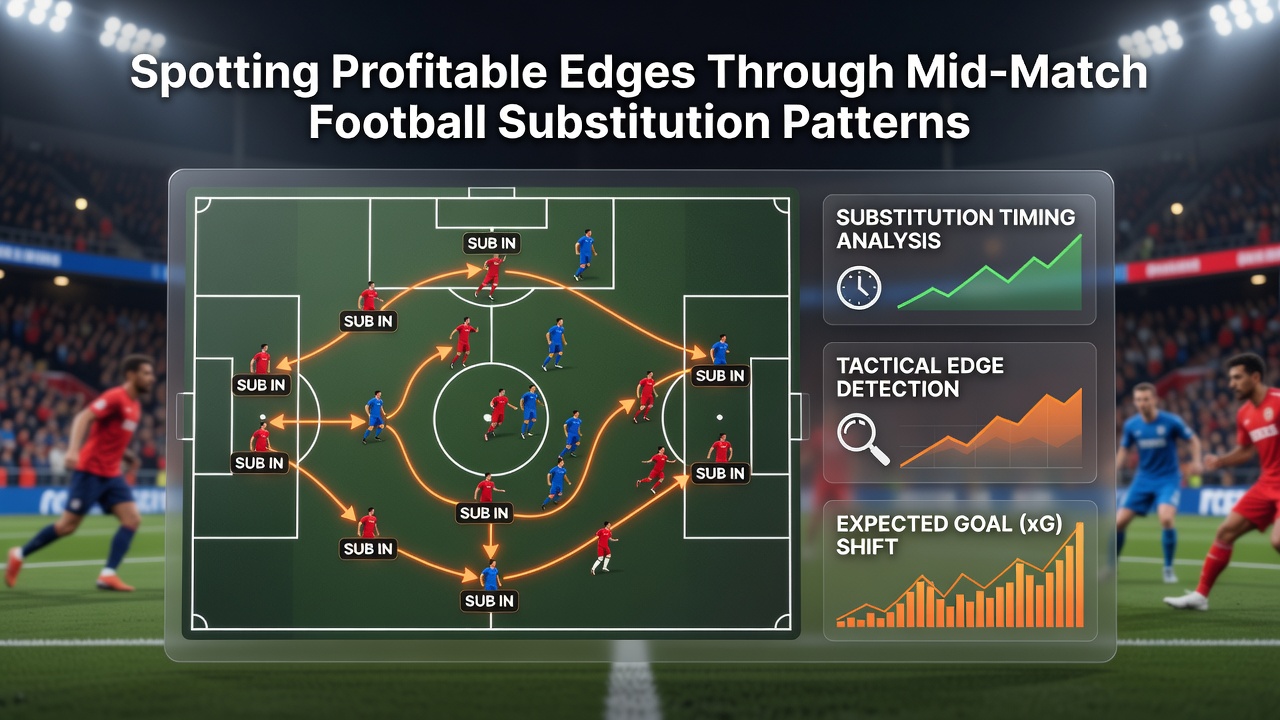
Football Substitution Trends: Examining Mid-Game Changes for Live Market Signals
Football matches often turn on the timing and nature of player replacements, and researchers tracking these moments have identified recurring sequences that align with shifts in scoring rates and match control. Data collected across major European leagues shows substitutions typically cluster between the 60th and 75th minutes, a window when fatigue sets in and managers adjust formations to protect leads or chase results. Observers note that teams trailing by one goal introduce attacking players at higher rates during this period, while those ahead tend to reinforce defensive lines with midfielders or full-backs.
Rules and Timing Structures in Professional Leagues
Current regulations permit up to five substitutions per team in most domestic and international competitions, with the allowance sometimes rising to six during extra time in cup ties. League records indicate that the average match sees between 4.2 and 4.8 total changes, and these numbers have risen steadily since the temporary COVID-era expansions became permanent in several federations. The third substitution frequently occurs around the 65-minute mark, creating a natural checkpoint where both sides reassess their tactical setups simultaneously.
Observed Patterns Across Top Divisions
Analysts examining Bundesliga and Serie A fixtures from the past three seasons found that teams making an early attacking substitution after conceding often increase their expected goal output by 0.15 to 0.25 per remaining 90 minutes. In contrast, defensive-minded replacements correlate with a measurable drop in opponent shot quality when the scoreline favors the substituting side. Figures from the 2025-26 campaign reveal that matches featuring three or more substitutions before the 70th minute produce 12 percent more goals in the final 20 minutes than games with fewer early changes.
What's interesting is how position-specific swaps influence these outcomes. Replacing a central midfielder with a winger tends to stretch the pitch and create wider channels, while swapping a striker for another forward frequently raises the frequency of high-quality chances inside the penalty area. Data platforms recording these granular adjustments have documented consistent edges in certain scoreline contexts, particularly when a side needs a result to advance in knockout stages.
Statistical Links to Match Results and Live Markets
Studies conducted by sports analytics groups show that substitution timing interacts with score differential in predictable ways. When a team behind by two goals introduces two offensive players within five minutes of each other, the probability of scoring at least once in the remaining time rises compared with baseline expectations. Conversely, leaders who bring on defensive reinforcements at the same stage reduce the likelihood of conceding by measurable margins. These shifts appear in aggregate data rather than individual matches, yet they provide reference points for those monitoring live odds movements.

During July 2026, several pre-season tournaments adopted experimental substitution rules allowing six changes per side, and early reports from those events indicated even sharper spikes in goal tallies after multiple late alterations. Such variations offer additional datasets for comparison against standard league conditions. Those reviewing the numbers emphasize that context matters, including team form, opponent strength, and weather factors that affect player endurance.
Integration with Broader Performance Metrics
Advanced tracking systems now combine substitution logs with physical data such as distance covered and high-intensity sprints completed. One research paper from an Australian sports institute highlighted that players entering the field after the 75th minute maintain higher sprint outputs than those who started, a pattern that holds across different leagues. When these fresh entrants occupy forward positions, the rate of shots on target from the substituting team increases in the subsequent 15-minute interval. Such findings appear in peer-reviewed journals and feed into models used by professional scouting departments.
But here's the thing: not every substitution produces the expected effect, and variance remains high at the single-match level. Aggregated trends across hundreds of fixtures therefore serve as the primary guide for identifying recurring signals rather than isolated instances.
Conclusion
Substitution patterns supply one layer of information within the larger picture of live football analysis. Records from multiple competitions demonstrate measurable correlations between the type, timing, and frequency of changes and subsequent scoring rates. Those examining these sequences across different leagues continue to refine their datasets, incorporating variables such as player age, recent minutes played, and tactical formations. The resulting observations remain available for anyone reviewing match statistics and performance indicators in real time.