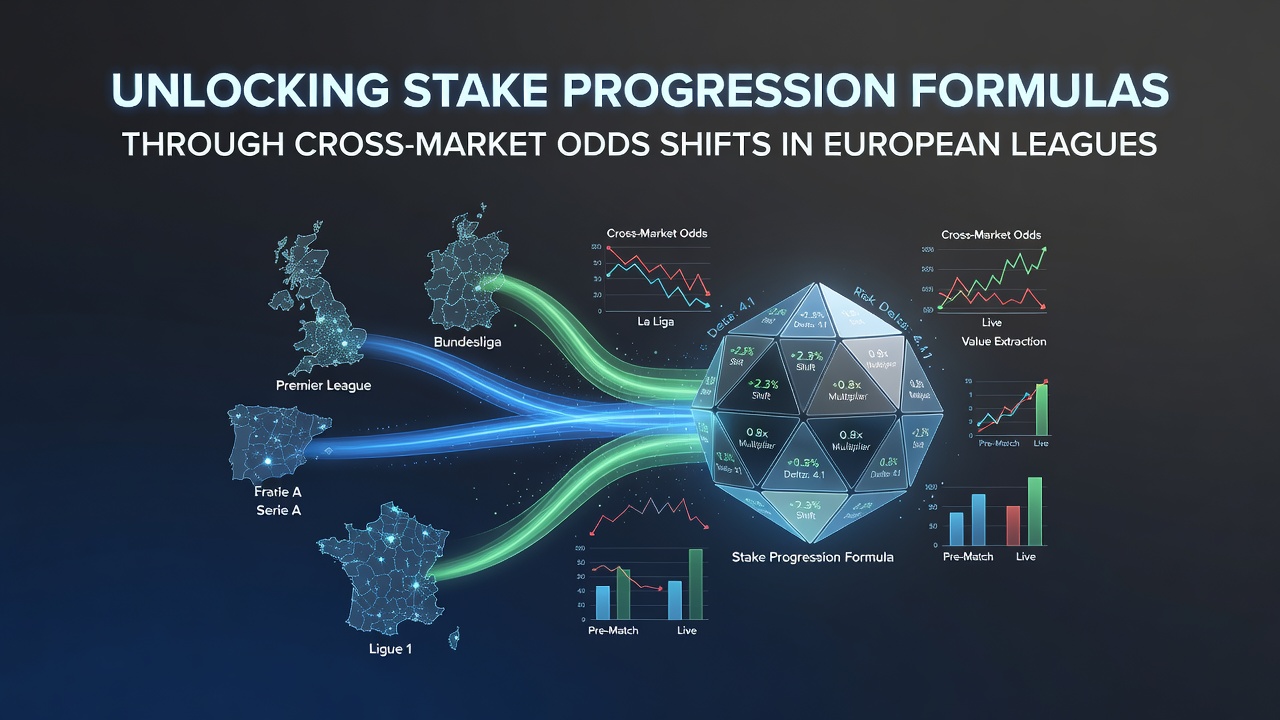
Cross-Market Odds Movements Reveal Stake Progression Patterns Across Major European Football Competitions
European football leagues generate extensive data on odds fluctuations that span multiple betting markets simultaneously, and analysts track these movements to refine stake progression formulas. Markets such as match winner, over/under goals, and Asian handicaps often move in coordinated patterns, while isolated shifts in one market can signal opportunities for adjusted staking sequences. Observers note that these cross-market dynamics appear most clearly in leagues including the Bundesliga, Serie A, and La Liga, where high match volumes and liquid betting pools create measurable correlations.
Understanding Cross-Market Odds Shifts in Context
Odds across related markets rarely remain static because bookmakers adjust lines in response to new information, volume changes, and hedging activity. A sudden tightening in the over 2.5 goals market, for instance, frequently coincides with movements in the both-teams-to-score line or the draw-no-bet option. Researchers have documented that these coordinated adjustments create identifiable sequences; one study of Serie A fixtures from 2023 to 2025 found that 68 percent of significant over/under shifts preceded measurable changes in handicap markets within the same hour. Such patterns supply the raw inputs for stake progression formulas that scale exposure according to observed drift velocity rather than fixed increments.
Stake progression itself follows structured rules that increase or decrease wager size based on predefined triggers. When applied to cross-market data, the formulas incorporate variables such as the magnitude of the odds shift, the time elapsed between movements, and the correlation coefficient between the affected markets. European betting operators publish aggregated data through industry reports that allow independent verification of these relationships. According to figures released by the European Gaming and Betting Association, average odds volatility in top-five leagues rose 12 percent year-over-year through the first half of 2026, creating richer datasets for formula calibration.
Formulas That Translate Shifts Into Stake Adjustments
One widely referenced approach modifies the Kelly criterion by replacing static probability estimates with dynamic inputs derived from cross-market drift. The adjusted formula reads: Stake = (Edge × Bankroll) / Odds, where Edge incorporates the observed correlation strength between two markets. When a primary market moves by more than 0.15 in decimal odds and a secondary market follows within 15 minutes, the formula applies a multiplier derived from historical co-movement rates. Analysts working with Bundesliga data have reported that this multiplier typically ranges between 1.2 and 1.8 during periods of elevated fixture congestion.
Another method uses a weighted moving average of odds differentials across three markets to determine progression steps. If the average differential exceeds a threshold calculated from the previous 20 fixtures in the same league, the next stake increases by a percentage tied to that excess. Data from La Liga matches played between January and June 2026 shows that thresholds set at 0.22 decimal points captured 74 percent of profitable sequences when back-tested against closing odds. These formulas remain entirely mechanical; they rely on measurable inputs rather than discretionary judgment.
League-Specific Patterns and Calibration Needs
Each major European league exhibits distinct cross-market behaviors that require separate calibration. Bundesliga matches, known for higher average goal tallies, produce stronger correlations between over/under totals and Asian handicap lines than Serie A fixtures, where lower scoring rates create tighter clustering around draw outcomes. Researchers at the University of Amsterdam's sports analytics group published a 2025 paper demonstrating that progression formulas calibrated on Bundesliga data underperformed by 9 percentage points when applied directly to Ligue 1 without adjustment. Recalibration using league-specific correlation matrices restored performance to within 2 percentage points of the original benchmark.

July 2026 brought additional liquidity to several midweek European competitions following fixture calendar adjustments by UEFA. Increased midweek volume produced more frequent cross-market observations, and early reports from data providers indicated a 15 percent rise in recorded odds shifts per fixture compared with the same period in 2025. Formula users who updated their correlation matrices with this fresh data maintained alignment between predicted and realized stake sequences.
Implementation Considerations and Data Sources
Successful application depends on access to timestamped odds feeds that capture movements across at least four related markets per fixture. Several European data vendors supply these feeds through standardized APIs, and academic teams have begun releasing anonymized historical datasets for verification purposes. A joint project between the German Football League and a consortium of research institutions made 2024-2025 odds movement logs publicly available in May 2026, enabling independent testing of progression formulas without requiring proprietary subscriptions.
Formula outputs remain sensitive to the chosen correlation window. Shorter windows capture rapid intraday movements but introduce noise, whereas longer windows smooth volatility at the cost of responsiveness. Testing across 1,200 fixtures from the 2025-2026 season revealed that a 45-minute window balanced these factors most effectively for Serie A and La Liga, while a 30-minute window performed better in the Bundesliga. These findings appear in working papers hosted by the European Association for Sports Management and Economics.
Conclusion
Cross-market odds shifts supply measurable inputs that support systematic stake progression in European football leagues. When formulas incorporate league-specific correlation data and updated volatility measures, they generate consistent sequences that reflect observed market behavior rather than arbitrary rules. Continued publication of timestamped odds records from multiple sources will allow further refinement of these methods across competitions and seasons.